
TL;DR:
- Projector native resolution is crucial for sharpness and clarity during chart presentations in Malaysia. A 1080p projector offers four times the pixel density of SVGA, ensuring legible data and labels on screens up to 150 inches. Brightness, ambient light, and aspect ratio also significantly influence chart visibility in classrooms and offices.
Projector resolution is defined as the total number of pixels a projector uses to display an image, expressed as width multiplied by height. For chart presentations in Malaysian classrooms and offices, resolution determines whether axis labels, data points, and grid lines appear sharp or blurry. The industry standard term is native resolution, which describes the actual pixel chip inside the projector. A projector with 1920×1080 native resolution delivers over four times the pixel density of the outdated SVGA standard at 800×600. That difference is visible the moment you project a detailed spreadsheet or bar chart onto a screen.
What is projector resolution for charts, and why does native resolution matter?
Native resolution is the only resolution number that truly counts. It describes the physical pixel grid on the projector's imaging chip. Maximum or "supported" resolution is a different figure entirely. A projector may accept a 4K input signal but display it through a 1080p chip, which means you never see true 4K pixel density.
Common resolutions you will encounter when shopping for a projector in Malaysia:
- SVGA (800×600): Obsolete for chart work. Text in Excel grids and PowerPoint labels becomes blurry at normal viewing distances.
- WXGA (1280×800): Acceptable for basic slides but struggles with dense data tables.
- Full HD / 1080p (1920×1080): The recommended minimum standard for professional chart presentations. Axis labels, legends, and percentage figures remain legible.
- WUXGA (1920×1200): A slight step up from 1080p, useful for 16:10 screens common in corporate meeting rooms.
- 4K UHD (3840×2160): Four times the pixels of 1080p. Genuine benefit for very large screens above 150 inches.
The gap between SVGA and 1080p is not subtle. SVGA gives you 480,000 pixels. Full HD gives you 2,073,600. That is a fourfold increase in the information your audience can read from the same chart.
Pro Tip: Always match your laptop or PC output resolution to the projector's native resolution. Scaling a 1080p signal through a 720p chip forces compression, which softens fine text and thin chart lines.
How does resolution affect chart clarity in Malaysian classrooms and offices?
Resolution alone does not guarantee a readable chart. Ambient light is the hidden variable that undermines even a high-resolution image. Malaysian classrooms and meeting rooms often have fluorescent overhead lighting or natural light from large windows. A projector with a sharp 1080p chip but only 1,500 lumens will produce a washed-out image in those conditions.

The brightness target for moderate ambient light is 2,500–4,500 ANSI lumens. ANSI lumens is the standardized measurement; LED lumens figures used in some product listings can be significantly inflated and should not be used for direct comparison.
Key factors that interact with resolution in typical Malaysian environments:
- Room lighting: Brighter rooms demand higher lumens, not just higher resolution.
- Screen size: A 1080p image on a 100-inch screen looks sharp. The same resolution stretched to 200 inches starts to show pixel structure.
- Viewing distance: Audiences seated beyond 8 meters benefit less from a resolution upgrade than from a brightness increase.
- Screen quality: A matte white projection screen reflects more evenly than a painted wall, making chart text crisper regardless of resolution.
Pro Tip: Before buying a higher-resolution projector, measure your room's ambient light level. In many Malaysian offices, upgrading from 2,500 to 4,000 lumens improves chart legibility more than moving from 1080p to 4K.
For classroom settings, the best classroom projector combines 1080p native resolution with at least 3,000 ANSI lumens. Brands like Epson projector Malaysia, Viewsonic projector Malaysia, and Optoma projector Malaysia all offer models in this range suited to Malaysian school environments.
What role do aspect ratios and resolution combinations play in chart quality?
Aspect ratio describes the shape of the projected image. It interacts directly with resolution to determine how much of your chart fills the screen and how pixels are distributed across it.
| Aspect Ratio | Common Resolution | Best Use Case |
|---|---|---|
| 4:3 | SVGA, XGA (1024×768) | Legacy classrooms, older LCD projectors |
| 16:9 | 1080p, 4K UHD | Modern business presentations, widescreen charts |
| 16:10 | WXGA, WUXGA | Corporate meeting rooms, dual-chart layouts |
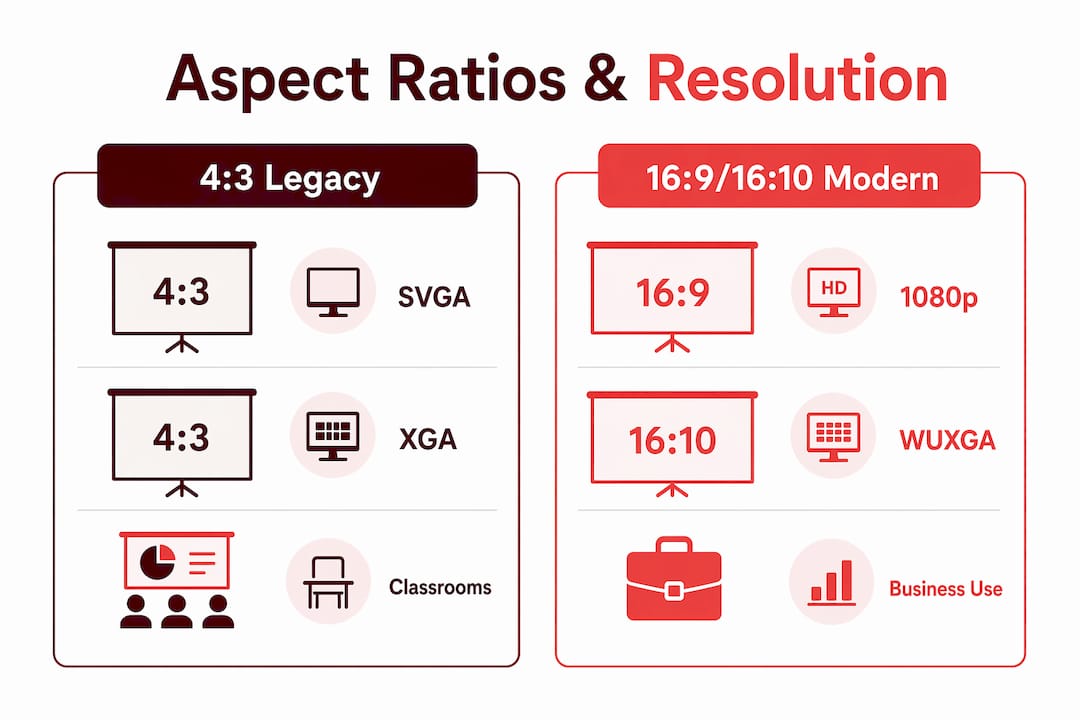
The 16:9 and 16:10 aspect ratios provide a wider workspace that suits side-by-side chart comparisons and complex spreadsheets. A 4:3 projector forces widescreen content into letterboxed bars at the top and bottom, wasting screen real estate and reducing the effective display area for your data.
WUXGA at 1920×1200 on a 16:10 screen gives you slightly more vertical space than standard 1080p. That extra height is useful when projecting tall bar charts or multi-row data tables. For most Malaysian offices running PowerPoint or Google Slides in 16:9 format, 1080p paired with a 16:9 screen is the most practical combination.
A 4:3 projector in a room with a 16:9 screen creates a mismatch. The image either stretches and distorts your chart proportions, or it shrinks to fit with black bars on the sides. Either outcome reduces clarity and professionalism.
Is 4K necessary for chart presentations, or is 1080p sufficient?
For the vast majority of chart presentations in Malaysia, 1080p is sufficient. 1080p projectors support clear text and spreadsheets and handle Full HD PowerPoint slides without compromise. The jump to 4K adds cost and complexity without a proportional gain in chart legibility for screens under 150 inches.
True 4K projectors carry a native 3840×2160 chip with four times the pixels of 1080p. That level of detail matters for cinematic content and very large venue displays. For a 100-inch screen in a boardroom, the human eye at a normal viewing distance cannot resolve the difference between 1080p and 4K on static chart text.
Mid-range projectors marketed as "4K supported" use a technology called pixel shifting, also known as E-shift. Pixel shifting builds a 4K image from a 1080p chip by rapidly moving pixels to fill in additional detail. This works reasonably well for video. For static charts, the improvement over native 1080p is negligible.
Situations where higher resolution genuinely adds value:
- Screens larger than 150 inches: Pixel structure becomes visible at 1080p on very large displays.
- Detailed engineering or medical diagrams: Fine lines and micro-text benefit from true 4K density.
- Audiences seated very close to the screen: Higher resolution allows closer seating without pixelation, though font sizes must be adjusted accordingly.
Pro Tip: Ignore "4K supported" or "4K compatible" labels when evaluating chart projectors. Ask specifically for the native resolution. A projector with native 1080p and 4,000 ANSI lumens outperforms a pixel-shifting "4K" unit with 2,000 lumens for every chart presentation scenario.
For a detailed comparison, Projectordisplay covers the Full HD vs 4K decision specifically for Malaysian buyers.
How to choose the right projector resolution for chart presentations in Malaysia
Selecting the right resolution requires matching the projector to your specific room, content, and budget. Follow this process:
- Measure your room and screen size. Rooms under 8 meters deep with screens up to 120 inches work well with 1080p. Larger venues may warrant WUXGA or true 4K.
- Assess ambient light. Rooms with uncontrolled daylight need at least 3,500 ANSI lumens. Controlled dark rooms can use lower-brightness units.
- Identify your content format. PowerPoint and Google Slides in 16:9 format pair best with a 1080p or WUXGA projector on a 16:9 screen.
- Match native resolution to your source. Matching output to native resolution prevents scaling artifacts that blur chart text.
- Set a realistic budget. For most Malaysian classrooms and offices, a 1080p projector in the mid-price range from brands like Epson projector Malaysia, BenQ projector Malaysia, or Panasonic projector Malaysia delivers the best value.
- Check screen compatibility. A high-resolution projector paired with a low-quality screen loses much of its advantage. Pair it with a proper projection screen material suited to your room.
Pro Tip: When comparing projectors at a projector shop in Malaysia, ask the seller to project a spreadsheet, not a photo or video. Charts expose resolution weaknesses that cinematic content hides.
Projectordisplay stocks a wide range of projectors from Epson, Viewsonic, BenQ, Optoma, and other leading brands. Whether you need a best office projector, best classroom projector, or a wireless projector Malaysia solution, the catalog covers all resolution tiers with verified native specs.
Key Takeaways
For chart presentations in Malaysia, native 1080p resolution paired with adequate brightness is the most effective and cost-efficient specification combination available in 2026.
| Point | Details |
|---|---|
| Native resolution is what matters | Always verify native resolution, not "supported" or "compatible" figures, before buying. |
| 1080p is the professional baseline | Full HD at 1920×1080 provides over four times the pixel density of SVGA for sharp chart text. |
| Brightness complements resolution | Target 2,500–4,500 ANSI lumens for Malaysian classrooms and offices with ambient light. |
| Aspect ratio affects chart layout | Use 16:9 or 16:10 projectors for modern presentations; 4:3 wastes screen space on widescreen content. |
| 4K adds limited value for charts | Pixel-shifting "4K" units offer negligible improvement over native 1080p for static chart presentations. |
Why I always tell Malaysian buyers to ignore the resolution headline
After working with educators, corporate trainers, and procurement teams across Malaysia, the pattern is consistent. Buyers fixate on the resolution number printed on the box and overlook the two factors that actually determine whether their audience can read a chart: native resolution and brightness.
A projector labeled "4K supported" with 1,800 lumens will produce a dim, washed-out image in a standard Malaysian classroom. A native 1080p unit with 4,000 ANSI lumens from a trusted brand like Epson LCD projector or a Viewsonic projector Malaysia model will make every bar chart and data table legible from the back row.
The other mistake I see regularly is mismatched aspect ratios. A buyer purchases a 4:3 LCD projector because it is cheaper, then projects 16:9 PowerPoint slides. The chart shrinks, the labels become unreadable, and the audience loses confidence in the presentation. The fix costs nothing: match the projector's aspect ratio to your content format before you buy.
My honest recommendation for most Malaysian schools and offices is a native 1080p projector with at least 3,000 ANSI lumens, a 16:9 aspect ratio, and a proper matte white screen. That combination handles every chart, spreadsheet, and data visualization you will encounter. Spend the budget difference on a better screen, not a pixel-shifting 4K upgrade you will never fully use.
— Projector
Projector Display Malaysia has the right resolution for your charts
Projectordisplay is one of the best projector sellers in Malaysia, offering a curated range of projectors matched to real classroom and office needs. Whether you need a best classroom projector with verified ANSI lumens, a portable projector for business presentations, or a wireless projector Malaysia setup for flexible meeting rooms, the catalog covers every resolution tier with honest native specs.
Projectordisplay carries models from Epson projector Malaysia, Viewsonic projector Malaysia, BenQ projector Malaysia, Optoma projector Malaysia, Panasonic projector Malaysia, and more. Every listing includes native resolution, ANSI lumens, and aspect ratio so you can compare accurately. For large venues, the guide on projectors for large rooms explains which resolution tiers make sense at scale. Fast shipping across Peninsular Malaysia and WhatsApp support make it easy to get the right projector for your next presentation.
FAQ
What is the minimum projector resolution for chart presentations?
Full HD at 1920×1080 is the recommended minimum for professional chart presentations. SVGA at 800×600 is obsolete for any setting where text legibility matters.
Does 4K resolution improve chart clarity over 1080p?
For screens under 150 inches, the difference is negligible for static charts. Pixel shifting technology used in mid-range "4K" projectors offers minimal improvement over native 1080p for text and grid-based visuals.
How many lumens do I need alongside my projector resolution?
Target 2,500–4,500 ANSI lumens for rooms with moderate ambient light, such as typical Malaysian classrooms and offices. Brightness affects chart legibility as much as resolution does in lit environments.
What aspect ratio is best for business chart presentations?
The 16:9 and 16:10 aspect ratios are best for business charts and modern presentations. They provide wider workspace for side-by-side comparisons and match standard PowerPoint and Google Slides formats.
What does "4K supported" mean on a projector spec sheet?
"4K supported" means the projector accepts a 4K input signal but displays it through a lower-resolution chip, typically 1080p. Native resolution determines actual pixel density, not signal compatibility, so always check the native spec before buying.